What They Missed · Part 07/10
It is the early hours of Saturday, 3 October 2020. Somewhere in England's public-health data infrastructure, an automated job is doing what it has done every night for months: collecting COVID-19 test results from commercial laboratories — plain CSV files, one row per record — and loading them into a template that feeds the dashboards the country reads every afternoon.
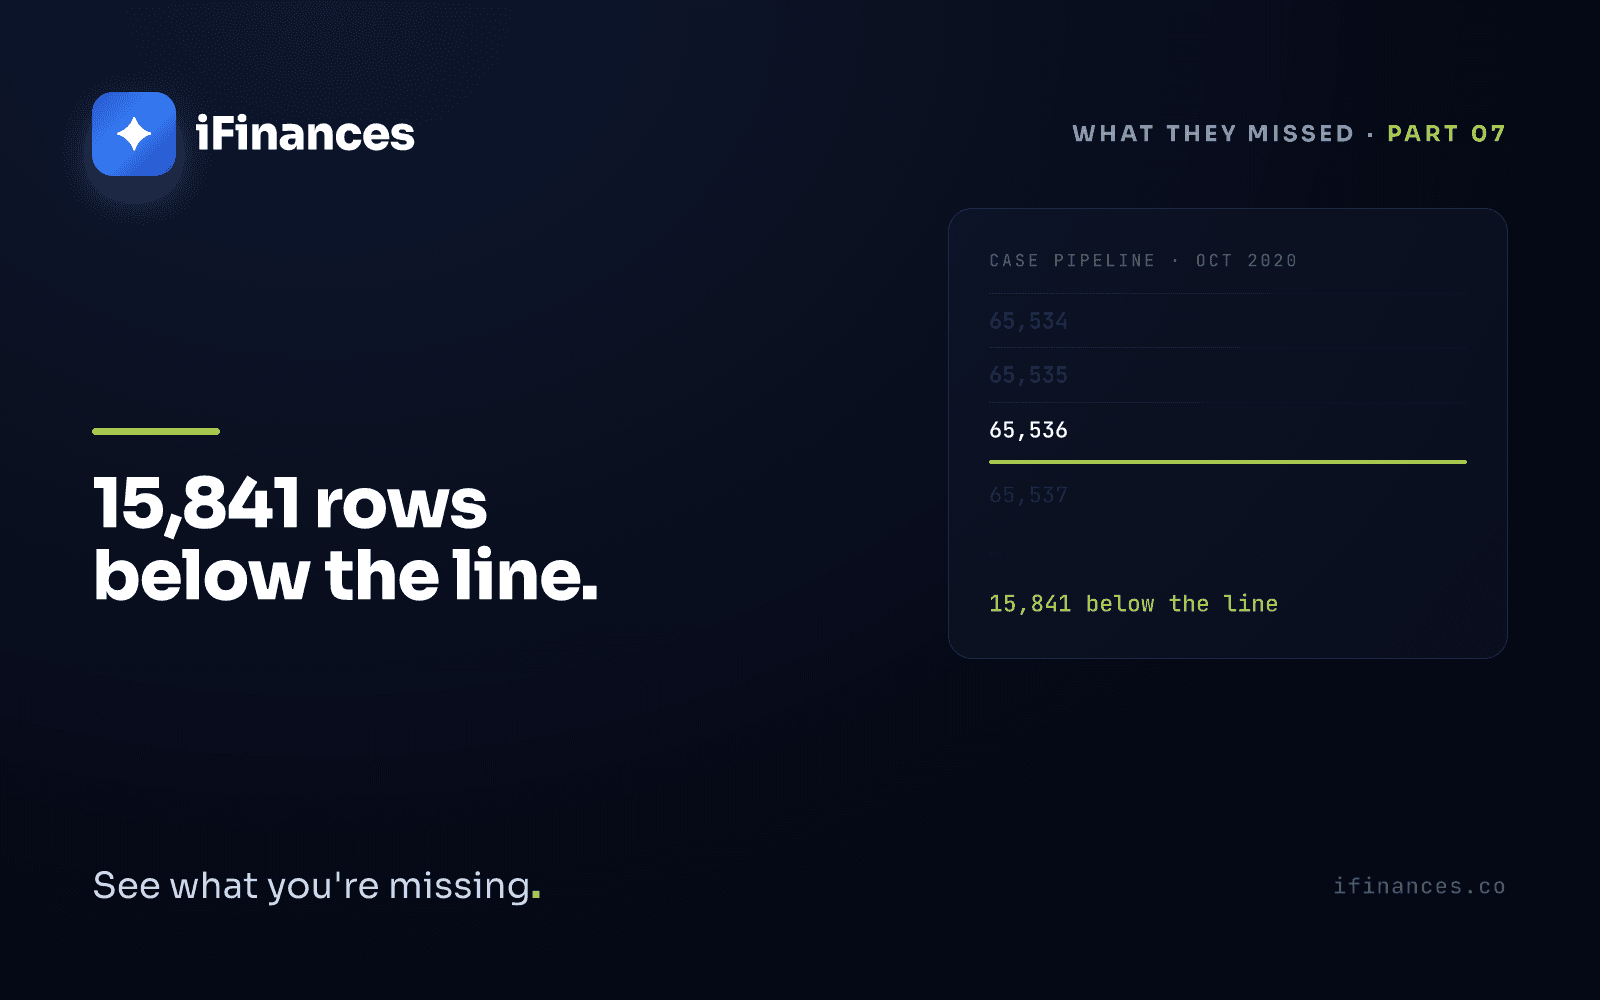
The template fills. Row 65,530. Row 65,534. Row 65,535. Row 65,536.
Then nothing. No error message, no warning, no failed status. The job completes. The file moves on. The dashboard updates. The daily case number appears on the evening news, gets compared with yesterday's, feeds the models, shapes the decisions.
The rows above the line are all real. The rows below the line are real too — they simply no longer exist anywhere the reporting process can see. For eight days, England's daily case counts have been arriving on schedule, neatly formatted, and incomplete. Nobody inside the pipeline knows, because every component of the pipeline is reporting success.
Tonight, someone finally notices that the numbers have stopped making sense.
What actually happened
On 4 October 2020, the UK government announced that 15,841 positive COVID-19 cases were missing from the daily reported figures for the period between 25 September and 2 October. The cases themselves were valid: the tests had been run, the results were positive, and the people concerned had been told. What failed was the step in between — the transfer from laboratory files into the central reporting and contact-tracing systems.
The mechanics were almost mundane. Test results arrived from laboratories as CSV files. An automated process at Public Health England loaded them into a legacy template saved in the older .xls Excel format — a format whose specification caps a worksheet at 65,536 rows. Each case consumed multiple rows of the template, which brought the practical ceiling down to roughly 1,400 cases per file. When a batch ran past that ceiling, the rows beyond it were not rejected, not flagged, not queued. They were simply left off.
Michael Brodie, interim chief executive of Public Health England, described the discovery in the agency's statement: "A technical issue was identified overnight on Friday 2 October in the data load process that transfers COVID-19 positive lab results into reporting dashboards."
The immediate mitigation, as reported, was simple: split the incoming files into smaller batches, so that no single file could reach the ceiling. The limit had not moved in decades; the pipeline had simply never been told about it.
The consequence was asymmetric. The missing cases had received their results, so those individuals knew. But their contacts had not been passed to the tracing teams, so the people they may have exposed did not. The backlog was pushed into the tracing system over the following days — days later than the process was designed to allow.
The format kept its promise
It is tempting to file this incident under "Excel error," and much of the coverage did. The record deserves a more careful reading.
The .xls format is a piece of 1980s engineering — its lineage goes back to 1987 — and its final revision, in place since 1997, states its capacity plainly: 65,536 rows, not one more. That is not a bug, and it is not a weakness. It is a published, documented limit that held exactly as specified for more than two decades. On the night of 2 October 2020, the format did precisely what its documentation said it would do. The tool kept its promise.
What broke was everything around it. A pipeline had been assembled in which a file could reach its documented capacity and keep going — silently, repeatedly, night after night — without any component asking the obvious question: does the number of rows coming out match the number of rows going in?
The signals were available. Files ending at exactly the same row count, batch after batch. Case counts flattening while test positivity did not. A reporting total that had quietly stopped tracking the inputs that produced it. Catching any of these required no foresight and no new technology. It required a layer whose entire job is to watch totals across a boundary — a control older than the spreadsheet and older than the computer: the control total. Count what went in, count what came out, and treat any difference as a question that must be answered before the process moves on.
The row limit was written in the specification for anyone to read. What was missing was the layer that watches the totals — the one that notices when files keep ending at exactly the same row.
Silent truncation is not a spreadsheet problem. It is what happens whenever data crosses a boundary and nothing on the far side confirms that it arrived complete.
What this means for your close
Your month-end close is also a pipeline. Bank statement exports, ERP extracts, e-invoice lists, ledger dumps, files passed between systems and between teams — each handoff is a boundary, and each boundary is a place where records can vanish without producing a single error message.
- A file that loads without errors is not the same as a file that is complete. "Import succeeded" tells you the process ran; it says nothing about what fell off along the way.
- Reconcile counts and sums at every boundary: rows and totals in the source against rows and totals in the destination. A gap of even one line is a question, not a rounding artifact.
- Be suspicious of regularity. Data that repeatedly stops at the same figure — the same row count, the same file size, the same cutoff date — is behaving like a limit, not like reality.
- Tools have limits by design; that is not a flaw. Processes fail when nothing watches the totals across them. The control belongs to the process, not to the tool.
A layer that watches the totals
This is precisely the place anomaly detection occupies in a finance stack. Not a smarter spreadsheet, and not a replacement for the tools you already run — a layer that sits across the boundaries and notices when the totals stop making sense. A batch of bank lines that comes in shorter than the pattern predicts. An invoice list whose count no longer matches the source system. Missing records and duplicates announce themselves the same way: not as errors, but as deviations from a pattern — and someone, or something, has to be watching the pattern to see them.
That is how iFinances treats the problem. It reads your bank, e-invoice, and ledger data side by side, keeps the counts and totals of each source in view, and flags the line — or the absence of a line — that breaks the pattern. It shows, suggests, and explains its reasoning; what a flag means, and what to do about it, stays a human decision. The point is not to distrust your tools. Spreadsheets remain excellent at the work they were designed for, and moving beyond them is a question of scale, not blame. The point is that no tool checks its own completeness from the outside. Something else has to stand at the boundary and count.
Frequently asked questions
Was Excel to blame for the missing cases?
No. The legacy .xls format enforced a documented limit of 65,536 rows, exactly as its specification had stated for decades — the format performed to spec. The failure sat in the pipeline around it: an automated process wrote past the limit, and nothing verified that the rows coming out matched the rows going in. The same silent truncation can happen with any tool whose limits a process quietly exceeds.
What kind of control would have caught the truncation earlier?
A completeness check — a discipline older than the spreadsheet, often called a control total. Count the records and sum the key figures at the source, do the same at the destination, and treat any difference as an exception that stops the process. In this case, files repeatedly ending at an identical row count would also have surfaced as an anomaly to any layer watching the shape of the data rather than individual records.
What does a 2020 public-health incident have to do with financial reconciliation?
A month-end close runs on the same architecture: files exported from one system and imported into another, across banks, ERPs, e-invoice platforms, and ledgers. Every one of those handoffs can truncate silently — a bank export that stops at a page limit, an extract that drops lines. Reconciliation is the discipline of confirming, at each boundary, that what arrived is what was sent.
Somewhere tonight, in your own infrastructure, a job very much like that one is running: collecting files, filling templates, reporting success. Almost all of them are telling the truth. The question the early hours of 3 October 2020 left behind is not whether your tools will honor their limits — they will, precisely, exactly as documented. The question is whether anything in your process would notice the night the totals quietly stop making sense, or whether the first sign will be a number on a dashboard that someone finally reads twice.
Frequently Asked Questions
Was Excel to blame for the missing cases?
No. The legacy .xls format enforced a documented limit of 65,536 rows, exactly as its specification had stated for decades — the format performed to spec. The failure sat in the pipeline around it: an automated process wrote past the limit, and nothing verified that the rows coming out matched the rows going in. The same silent truncation can happen with any tool whose limits a process quietly exceeds.
What kind of control would have caught the truncation earlier?
A completeness check — a discipline older than the spreadsheet, often called a control total. Count the records and sum the key figures at the source, do the same at the destination, and treat any difference as an exception that stops the process. In this case, files repeatedly ending at an identical row count would also have surfaced as an anomaly to any layer watching the shape of the data rather than individual records.
What does a 2020 public-health incident have to do with financial reconciliation?
A month-end close runs on the same architecture: files exported from one system and imported into another, across banks, ERPs, e-invoice platforms, and ledgers. Every one of those handoffs can truncate silently — a bank export that stops at a page limit, an extract that drops lines. Reconciliation is the discipline of confirming, at each boundary, that what arrived is what was sent.
✦ iFinances — See what you're missing.